まずRのメタアナリシス用のパッケージに何があるか聞いてみます。
Copilotの回答は青いブロックの右端のアイコンをクリックすると表示したり隠したりできます。
メタアナリシスのためのRのパッケージを教えて。
Rにはメタアナリシスを行うための便利なパッケージがいくつかあります。代表的なものを紹介しますね。
- metafor: メタアナリシスのための強力なパッケージで、固定効果モデルやランダム効果モデルの適用、フォレストプロットの作成などが可能です。
- meta: メタアナリシスのための包括的なパッケージで、異質性の評価や出版バイアスの検討など、多くの機能を備えています。
- rmeta: よりシンプルなメタアナリシスの実装を提供するパッケージで、基本的な統計解析を行うのに適しています。
これらのパッケージを使えば、メタアナリシスのデータ統合や異質性の評価、視覚化などがスムーズに行えます。どのパッケージを選ぶかは、分析の目的や必要な機能によります。試してみたいものはありますか?
Copilotの提案の中からmetaパッケージを使ってみようと思います。二値変数アウトカムの場合のメタアナリシスを実行するスクリプトを提案してもらいましょう。
Rのmetaパッケージで二値変数アウトカムの場合のメタアナリシスを
実行し、フォレストプロット、ファンネルプロットを作成します。
分散逆数法でランダム効果モデルを用います。対照群の症例数にnc、イベント数にrc、介入群の症例数にnt、イベント数にrtという変数名を使います。プロットは新規のウインドウにそれぞれ出力してください。
meta パッケージを使って、分散逆数法 に基づくランダム効果モデルを適用し、二値変数アウトカムのメタアナリシスを実行するRスクリプトを紹介します。フォレストプロットとファンネルプロットを 新規ウインドウ に出力します。
スクリプト
# 必要なパッケージの読み込み
library(meta)

# 仮のデータセット
dat <- data.frame(
  study = c("Study 1", "Study 2", "Study 3", "Study 4", "Study 5"),
  rt = c(10, 20, 15, 25, 30),  # 介入群のイベント数
  nt = c(100, 200, 150, 250, 300),  # 介入群の総数
  rc = c(5, 15, 10, 20, 25),  # 対照群のイベント数
  nc = c(100, 200, 150, 250, 300)   # 対照群の総数
)

# メタアナリシスの実行(分散逆数法を用いたランダム効果モデル)
meta_analysis <- metabin(rt, nt, rc, nc, data = dat,
                         studlab = study, sm = "RR", method = "Inverse",
                         fixed = FALSE, random = TRUE)
                         common = FALSE
# メタアナリシスの結果をコンソールに出力
print(meta_analysis)

# 新規ウインドウでフォレストプロットを作成
windows()
forest(meta_analysis, xlab = "Risk Ratio", ref = 1)

# 新規ウインドウでファンネルプロットを作成
windows()
funnel(meta_analysis)
ポイント
metabin()関数を使用して、二値変数アウトカムのメタアナリシスを実行。sm = "RR"でリスク比(Risk Ratio)を指定。method = "Inverse"で 分散逆数法 を適用。random = TRUEで ランダム効果モデル を使用。windows()を使って 新規ウインドウ にプロットを出力。
このスクリプトを実行すれば、分散逆数法を用いたメタアナリシスを適切に実施できます。試してみて、調整したい点があれば教えてくださいね!詳しい解説は こちら で確認できます。
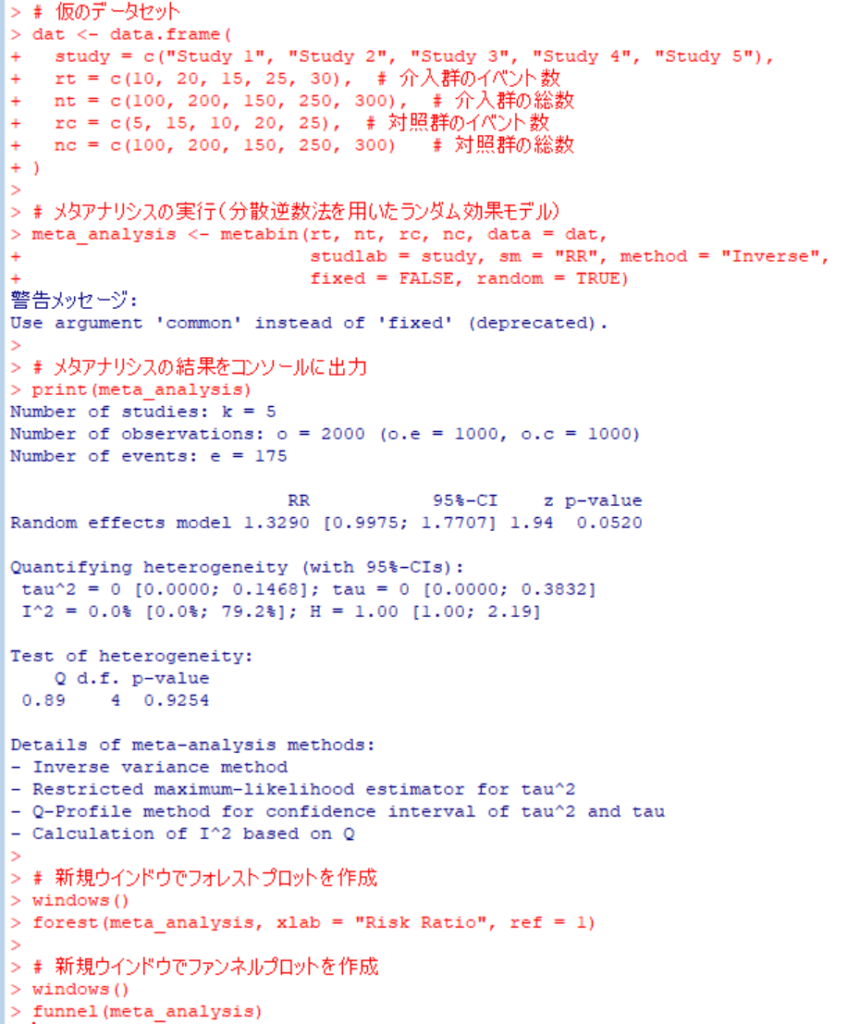
仮のデータセットの作成から、メタアナリシスの実行のスクリプトがコピーできる形で提案されたのでそのままRで実行したらこのような結果になりました。τ二乗値、I二乗値、統合値に対するZ値、p値も出力されています。


metabin()関数の実行でエラーメッセージが出ています。固定効果モデルの場合fixed = FALSEではなく、common = FALSEと記述するということです。実際にそのように書き換えて実行するとエラーメッセージは出なくなりました。上のスクリプトの赤字の部分です。
フォレストプロットに提示されているp値はQ統計値に対するp値で、統合値に対するp値はコンソールに出力されている、z p-valueの方です。この例では、0.0520でした。
さて、自分のデータセットでメタアナリシスをする場合、仮のデータセットの部分を書き換えて、以下同様にスクリプトを実行するのがひとつの方法です。
Excelでデータを用意する場合、study, nc, rc, nt, rtのラベルでそれぞれのデータを入力し、データ範囲を選択して、コピー操作をして、Rで次のスクリプトを実行します。
dat = read.table("clipboard", sep = "\t", header = TRUE)
例えば、このようなデータを用意して、左上のセルから右下のセルの範囲を選択して、コピー(Ctr+C)し、Rの方で、上記のスクリプトを実行すると変数datにデータが格納され、それをdatで確認できます。それ以下は同じスクリプトを実行します。次のような結果が得られました。


それでは、ファンネルプロットの非対称性のBeggの検定、Eggerの検定はどうするか聞いてみます。
metaパッケージでファンネルプロットの非対称性のBeggの検定、
Eggerの検定のためのスクリプトは?
その部分だけを示します。
# Begg検定(順位相関検定)
begg_test <- metabias(meta_analysis, method = "rank")
print(begg_test)

# Egger検定(回帰分析による検定)
egger_test <- metabias(meta_analysis, method = "linreg")
print(egger_test)
今回の例では、これらの検定は研究数が10個以上でないとできないという、エラーメッセージが出ました。
さて、統合値に対するPrediction Intervalも出力するにはどうするか聞いてみます。
metaパッケージで統合値に対するPrediction Intervalも出力し、
フォレストプロットにも追加するにはどうしますか?
関連したところだけを以下に示します。また、addpredとなっていた引数名をpredictionに訂正してあります。
# メタアナリシスの結果をコンソールに出力(予測区間を含む)
print(meta_analysis, prediction = TRUE)

# フォレストプロットの作成(予測区間を追加)
forest(meta_analysis, xlab = "Risk Ratio", ref = 1, prediction = TRUE)
これで出力されたフォレストプロットがこちらです。

さて、今回もCopilotの提案には間違いがありました。commonとすべきところがfixedに、predictionとすべきところがaddpredになっていました。それについて次の様に聞いてみたところ、正しいスクリプトが提案されました。
addpredではないのでは?
その通りです!meta パッケージのフォレストプロットで 予測区間 (Prediction Interval, PI) を追加するには、prediction = TRUE を指定します。
予測区間を出力し、フォレストプロットに追加する方法
# 必要なパッケージの読み込み
library(meta)

# 仮のデータセット
dat <- data.frame(
  study = c("Study 1", "Study 2", "Study 3", "Study 4", "Study 5"),
  rt = c(10, 20, 15, 25, 30),  # 介入群のイベント数
  nt = c(100, 200, 150, 250, 300),  # 介入群の総数
  rc = c(5, 15, 10, 20, 25),  # 対照群のイベント数
  nc = c(100, 200, 150, 250, 300)   # 対照群の総数
)

# メタアナリシスの実行(リスク比を使用)
meta_analysis <- metabin(rt, nt, rc, nc, data = dat,
                         studlab = study, sm = "RR", method = "Inverse",
                         fixed = FALSE, random = TRUE)

# メタアナリシスの結果をコンソールに出力(予測区間を含む)
print(meta_analysis, prediction = TRUE)

# フォレストプロットの作成(予測区間を追加)
forest(meta_analysis, xlab = "Risk Ratio", ref = 1, prediction = TRUE)
ポイント
print(meta_analysis, prediction = TRUE)を指定すると、統合値の 予測区間 がコンソールに出力されます。forest(meta_analysis, prediction = TRUE)を指定すると、フォレストプロットに 予測区間 が追加されます。
この方法を試してみて、さらにカスタマイズしたい点があれば教えてくださいね!詳しい解説は こちら で確認できます。
metabin()のfixedも違うのでは?
その通りです!meta パッケージの metabin() 関数では、固定効果モデルとランダム効果モデルの指定方法が fixed ではなく、common(固定効果モデル)と random(ランダム効果モデル)を使います。
正しいメタアナリシスの実行方法
# 必要なパッケージの読み込み
library(meta)

# 仮のデータセット
dat <- data.frame(
  study = c("Study 1", "Study 2", "Study 3", "Study 4", "Study 5"),
  rt = c(10, 20, 15, 25, 30),  # 介入群のイベント数
  nt = c(100, 200, 150, 250, 300),  # 介入群の総数
  rc = c(5, 15, 10, 20, 25),  # 対照群のイベント数
  nc = c(100, 200, 150, 250, 300)   # 対照群の総数
)

# メタアナリシスの実行(リスク比を使用)
meta_analysis <- metabin(rt, nt, rc, nc, data = dat,
                         studlab = study, sm = "RR", method = "Inverse",
                         common = FALSE, random = TRUE)

# メタアナリシスの結果をコンソールに出力(予測区間を含む)
print(meta_analysis, prediction = TRUE)

# フォレストプロットの作成(予測区間を追加)
forest(meta_analysis, xlab = "Risk Ratio", ref = 1, prediction = TRUE)
ポイント
common = FALSEで 固定効果モデルを無効化。random = TRUEで ランダム効果モデルを適用。print(meta_analysis, prediction = TRUE)で 予測区間を出力。forest(meta_analysis, prediction = TRUE)で フォレストプロットに予測区間を追加。
この方法を試してみて、さらにカスタマイズしたい点があれば教えてくださいね!詳しい解説は こちら で確認できます。
実際にRでスクリプトを実行するとエラーメッセージがでたり、思っているのと違ったことが実行されたりした場合、間違いと思われるところを指摘すると、訂正を提案してくれるようです。
最後に、forest()関数の引数refは何かを聞いてみました。
metaパッケージのforest()関数のref引数は何ですか?
meta パッケージの forest() 関数における ref 引数は、フォレストプロットの参照線の位置 を指定するためのものです。通常、効果量の基準値(例えば 1 や 0)を設定します。
ref 引数の使い方
forest(meta_analysis, xlab = "Risk Ratio", ref = 1)
ref = 1→ リスク比 (RR) の場合、1 を基準線として設定ref = 0→ 標準化平均差 (SMD) の場合、0 を基準線として設定
ポイント
refを指定すると、フォレストプロットに 垂直の基準線 が追加されます。- オッズ比やリスク比 の場合は
ref = 1が一般的。 - 標準化平均差 (SMD) の場合は
ref = 0を使用。
詳しい解説は こちら で確認できます。試してみたい設定はありますか?
フォレストブロットでX軸の無効果の位置に垂直線を引く時に値を指定するのが一般的な使い方の様です。
今回は、Copilotを利用することで、スクリプトをタイプする必要が無いというところは大きな利点であることを再確認しましました。
オッズ比、ハザード比、平均値差、標準化平均値差などほかの効果指標の場合はどうなるか、Copilotに聞いたら、スクリプトを提案してくれるでしょう。
追加:metaパッケージのforest()関数ではlayoutにJAMAのスタイル、RevMan5のスタイルを指定できます。
windows()
forest(meta_analysis, xlab = "Risk Ratio", ref = 1, layout="JAMA")

windows()
forest(meta_analysis, xlab = "Risk Ratio", ref = 1, layout="RevMan5")

上がJAMAのスタイル、下がRevMan5のスタイルで、デフォルトとはデザインが違います。


